volume profile
Volume is one of the most telling and fundamental indicators in trading. The type of volume you are probably used to seeing is the vertical volume bars on the bottom of your chart, in other words, volume by time. Volume by time shows how many shares were transacted on a given date. Volume profile on the other hand, is volume by price. Volume profile shows where the most shares were traded at a given price range. This enables us to analyze a chart with volume by price rather than by time. The most important aspect of volume profile is that it allows us to get a better perspective on where buyers are likely to defend price, and where sellers are likely to step in and add supply to the market. The data that is provided by Volume Profile is indisputable, leaving it to the trader to find new and creative ways to use it.
basic principles
-Volume profile shows us volume by price
-Significant areas within the Volume profile display where the most trading activity occurred over a specified time period
-These significant areas include :
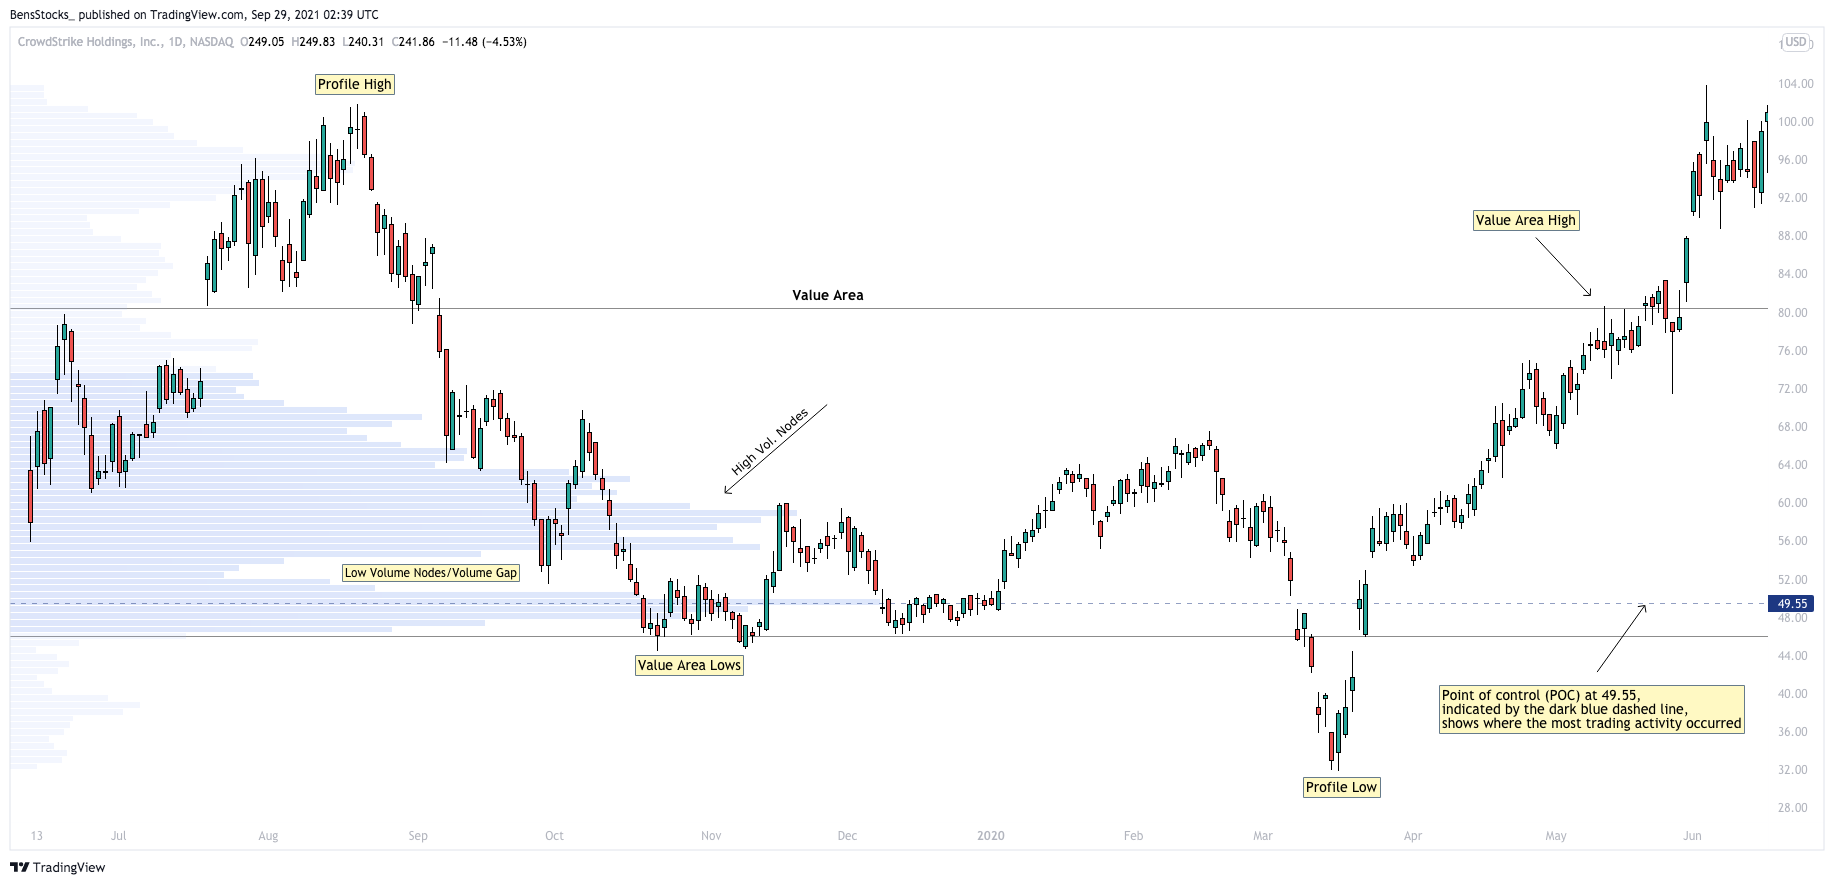
- Point of Control (POC) – The price level at which the most transactions occurred
- Profile High – The highest reached price level during the specified time period.
- Profile Low – The lowest reached price level during the specified time period.
- Value Area (VA) – The range of price levels in which a specified percentage of all volume was traded during the time period. Typically, this percentage is set to 70% however it is up to the trader’s discretion.
- Value Area High (VAH) – The highest price level within the value area.
- Value Area Low (VAL) – The lowest price level within the value area.
Support and resistance
-Using volume profile as an identifier for support and resistance levels is a reactive method
-This means that unlike proactive methods (such as trend lines and moving averages), which are based on current price action and analysis to predict future price movement, reactive methods rely on past price movements and volume behavior
-Reactive methods can be useful in applying meaning or significance to price levels where the market has already visited
-A price level near the bottom of the profile with volume favoring the buy side is a good indication for a support level
-A price level near the top of the profile which heavily favors the sell side volume is a good indication of a resistance level
volume nodes
High Volume Nodes
-High volume nodes (HVN) are peaks in volume at or around a price level
-Usually there is a great deal of activity in both the buy and sell side of the market, and price stays in that level for a great deal of time compared to other levels in the profile (price is in agreement)
-When the market stays at a certain price level for a ling period of time compared to other levels in the profile, buyers and sellers are in agreement at that price level, creating a “fair value area” for the asset
-When price approaches a previous HVN, or fair value area, a sustained period of sideways movement is expected- the market is unlinkely to immediately break through that price
Low Volume Nodes
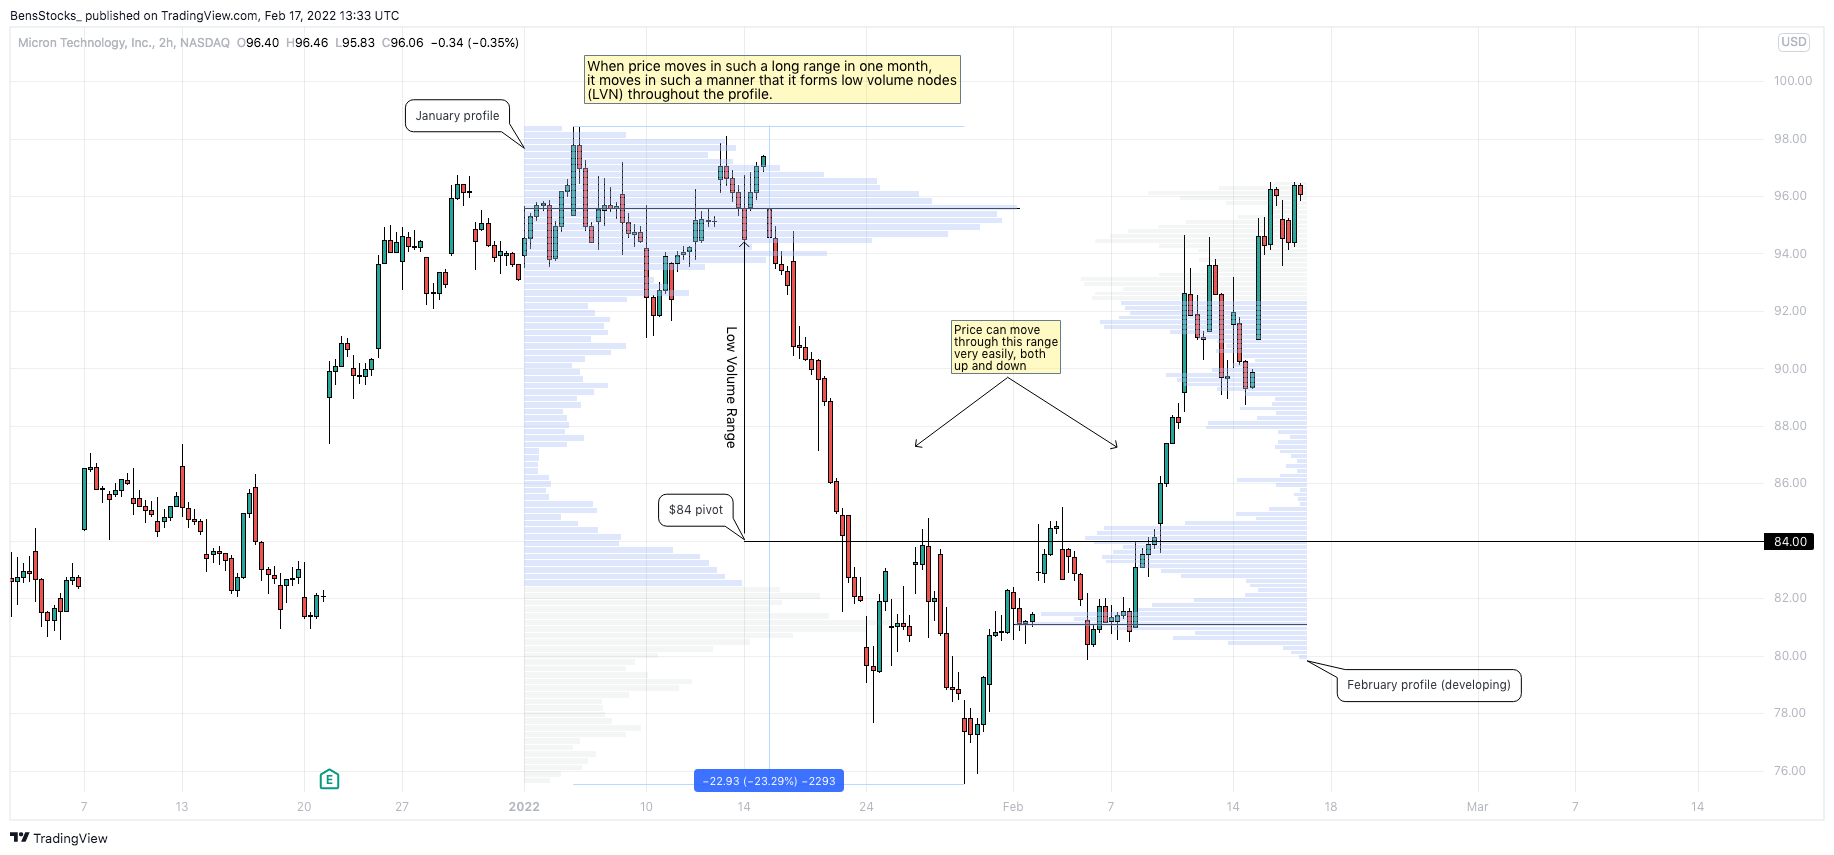
-Low volume nodes are valleys, or significant drops in volume in a given price range
-Low volume nodes are a consequence of a quick movement in price; not a lot of orders can get filled when price in heading in a direction with momentum
-The drop off in volume cab imply an “unfair value area” (buyers or sellers are in control) for the asset
-When price approaches a previous low volume node, or unfair value area, the market is more likely to move quickly through that area (these are also referred to as volume gaps)
-Since is is seen as an unfair value area, the market will not spend more time there- price goes where the orders are
Volume profile, a visual representation of supply and demand
Volume profile and supply and demand trading go hand in hand. Mainly for the reason that volume profile gives a visual representation of what price the most shares of the underlying are being traded at. Volume profile shows where the most sell orders are (supply), as well as the most buy orders (demand). High volume nodes & the point of control (POC) are indications of institutional activity.
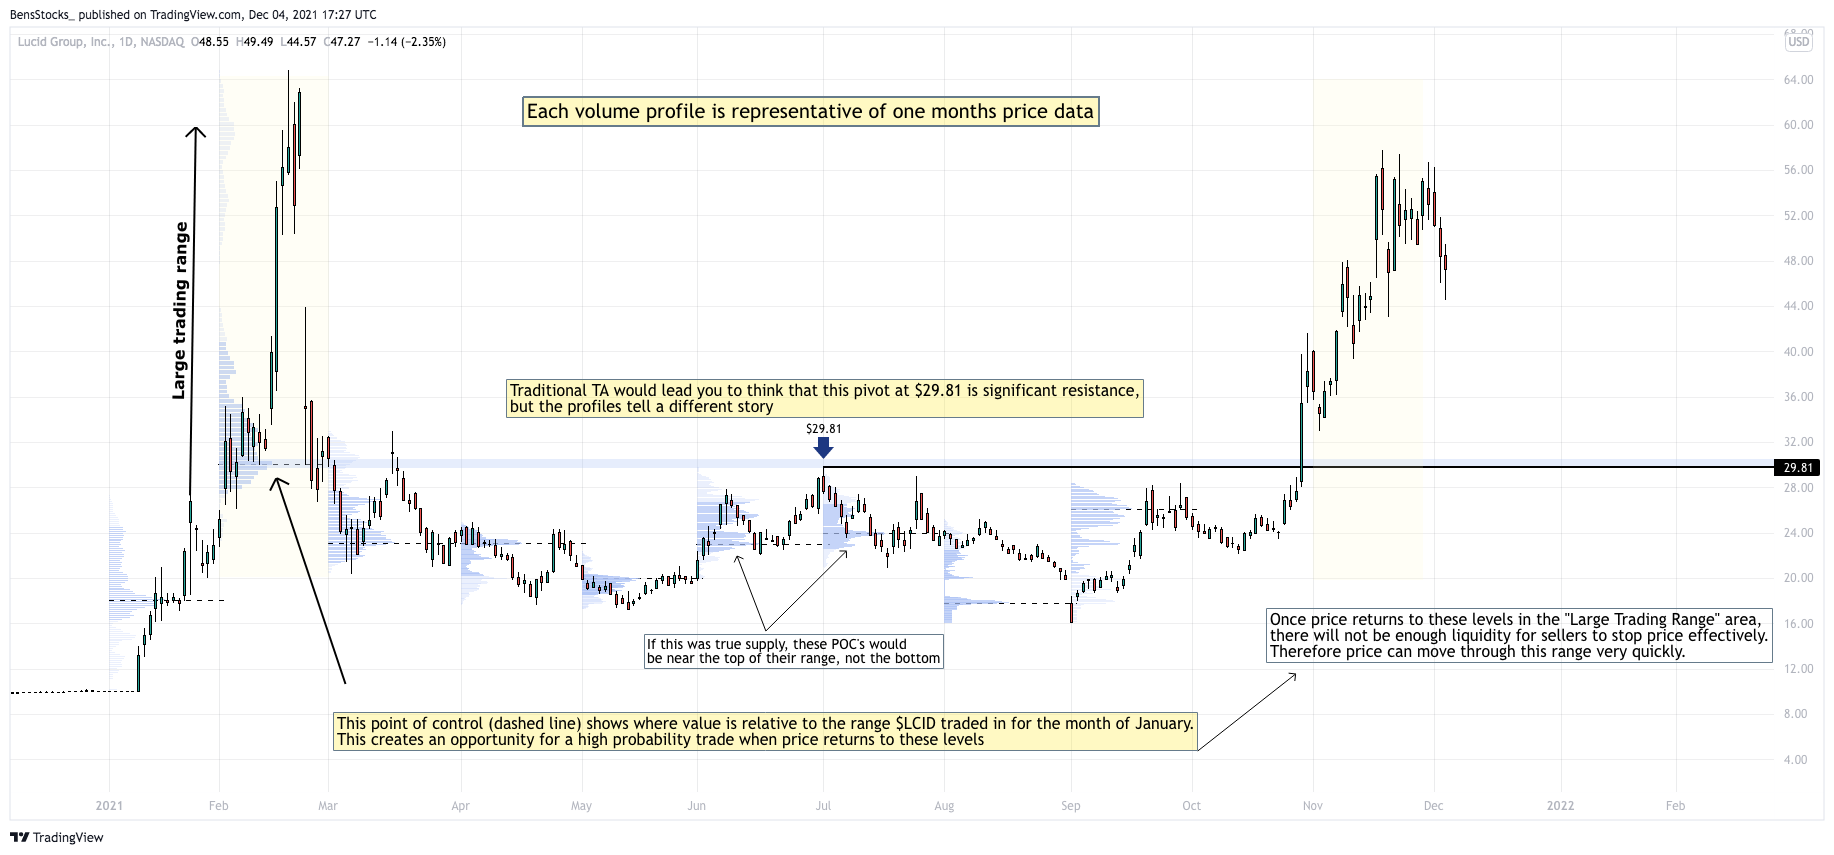
monthly profiles
Time is the only constant variable in financial markets. It never changes and cannot be influenced by any external factors. This allows us to interpret the data from an objective standpoint, it is non-disputable. It is for this reason that drawing in volume profiles on a month to month basis can help give you a realistic approach to your tradaes. There are a few type of trades you can put on that with the data from the volume profiles, that give you a definitive edge using the data from the profiles.


