1/24/2022-1/28/2022

indicies outlook
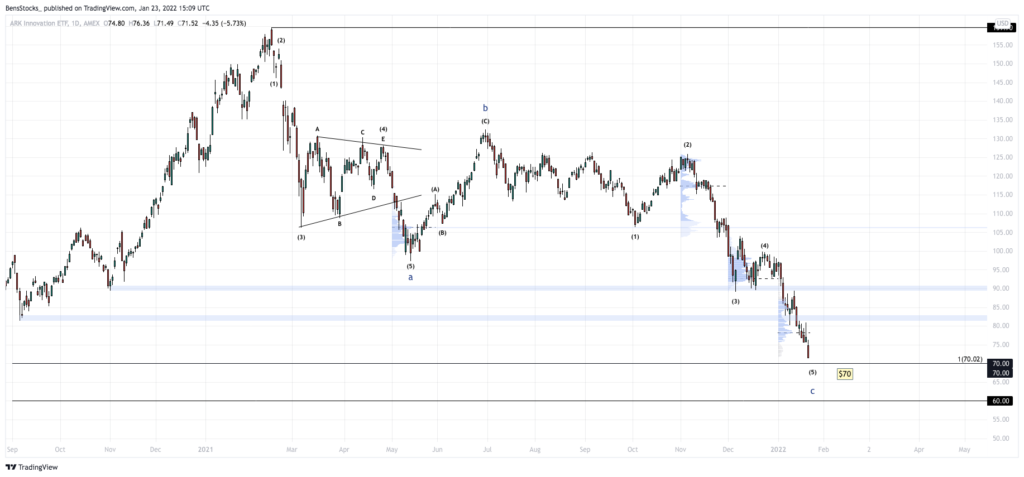
The carnage continued to ensue in growth names last week, despite the short four day week, sellers wasted no time. $ARKK is now down 55% from it’s all-time-high at $159.70. In the New Year alone $ARKK is down 26%. $ARKK must defend $70 this week. If $70 is lost, $60 will likely follow.
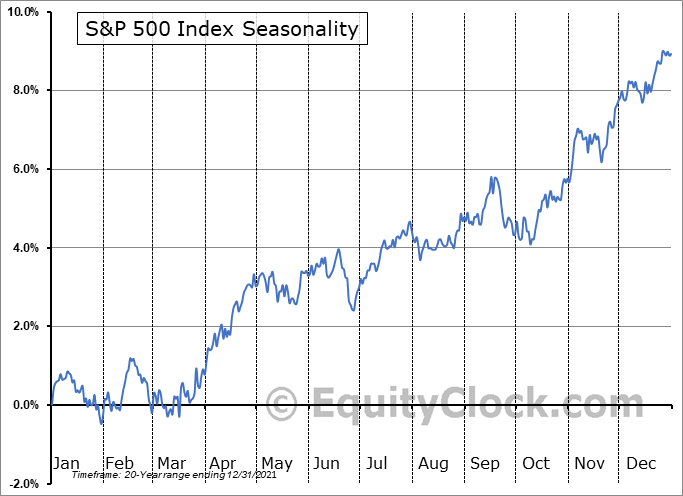
Unlike growth stocks and the Cathie Woods $ARKK etf, $SPY is just shy of making even a slight 10% correction, while only 8.75% away from an all time high at $480. In my eyes, this is not a “buy the dip” scenario (although I’d be happily proved wrong). January is typically a bearish month for the S&P 500, and the signs of further selling / downside are present. $ARKK and $SPY need a bounce soon, or the outlook for the rest of January is very grim. We need the data from this week to make a better decision. Big earnings and economic news this week, I feel however the market digests this week will be very telling. Let us get into the charts…
$arkk 1d scale
- A=C extension confluence at $70 support level
- If $70 fails to hold, $60 test will follow
- Cheap can always get cheaper
$arkk 1w scale
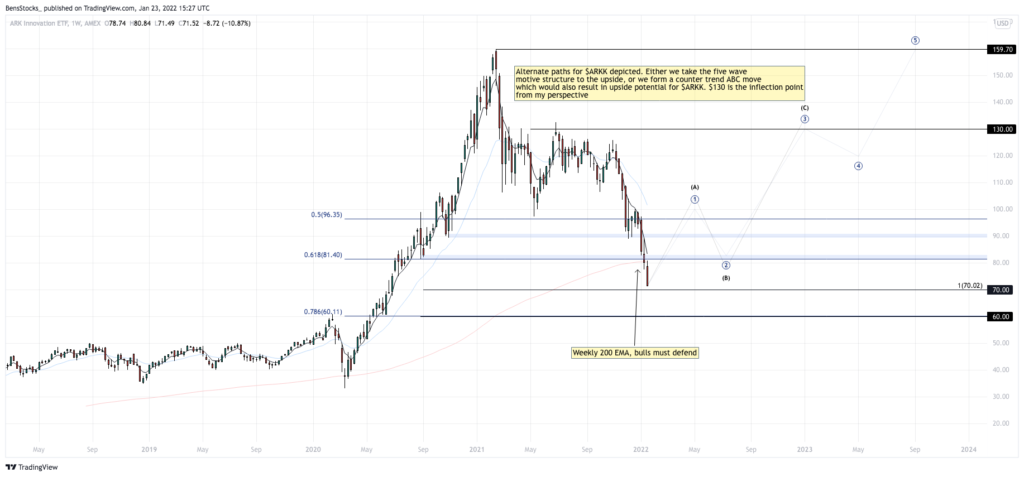
- Weekly 200 ema MUST be reclaimed
- Again, $70 must hold for bulls to have a shot at a reversal this week
- .786 retrace confluence with $60 support level
$abnb 1d scale
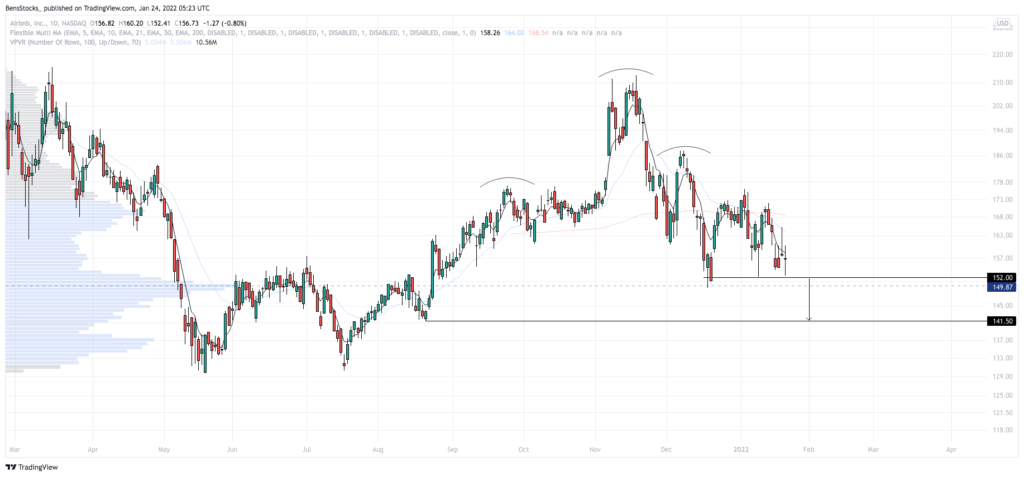
- Head and Shoulders pattern formed
- Trading below 200 day EMA
- Sell bias below $152 level
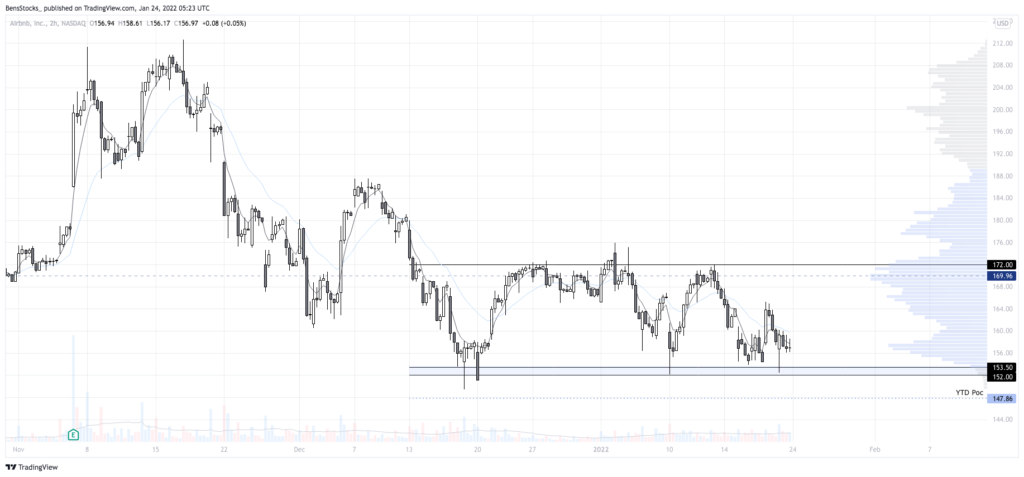
$abnb 2h scale
- Sideways price movement around HVN/ POC- basing for a directional move
- Take caution around $147.9 level, we must see initiative action below $152
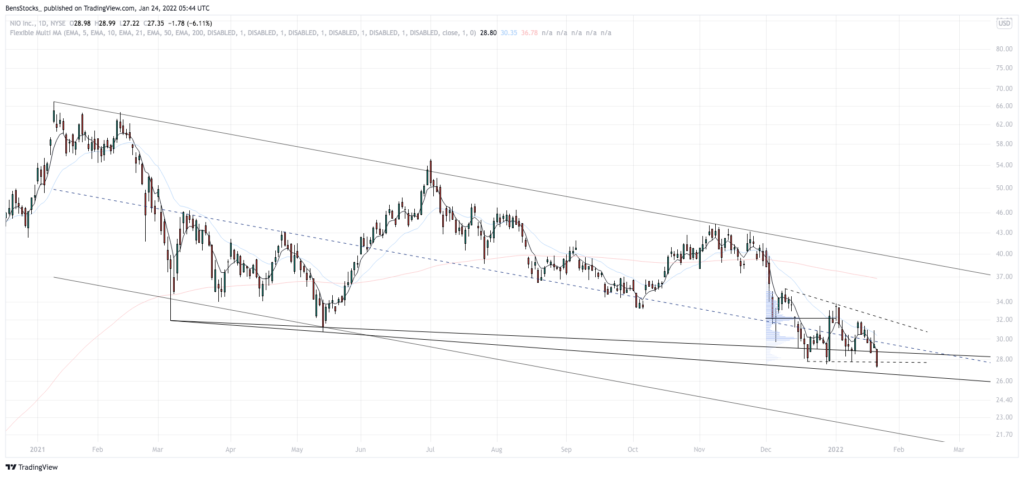
$nio 1d scale
- $NIO is trending in a downward channel
- Lost key $28 support
- Bearish continuation pattern
- EV sector will react to $TSLA earnings
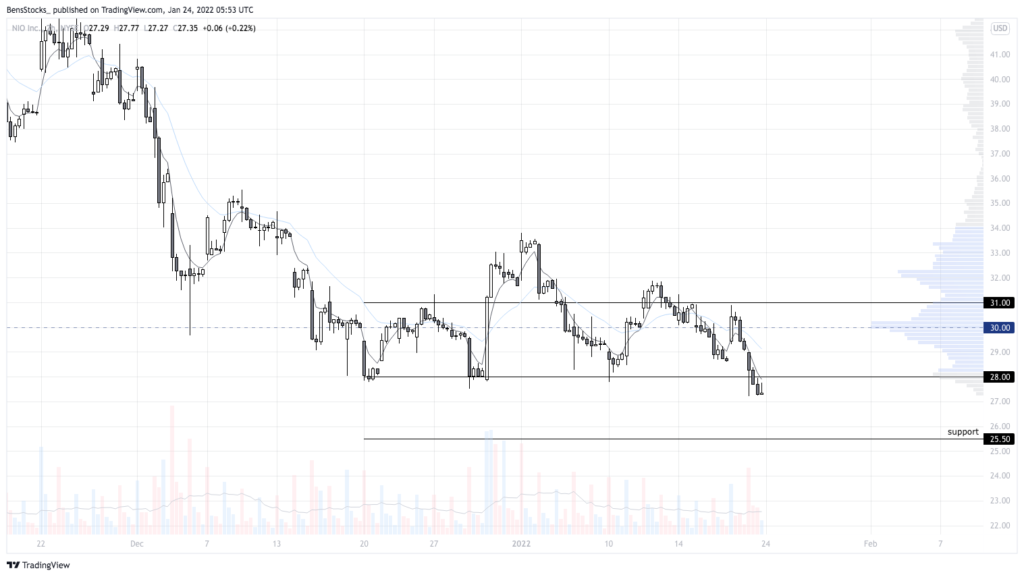
$nio 2h scale
- Sideways price movement around HVN/POC- basing for a directional move
- $28 macro support failed to hold
- $25.50 support
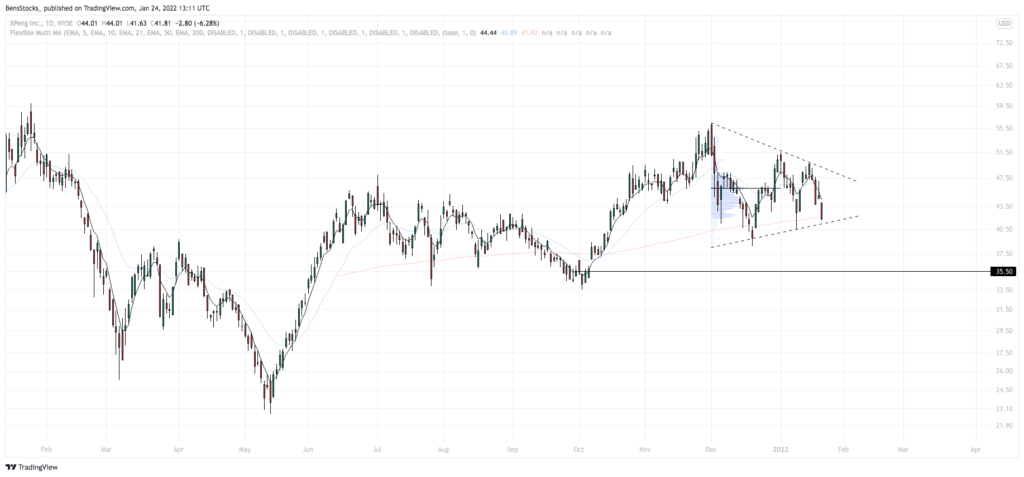
$xpev 1d scale
- EV sector showing weakness. Allow me to reiterate that $XPEV as well as $NIO will react to $TSLA earnings
- Losing 200 day EMA
- Symmetrical triangle formed
$xpev 2h scale
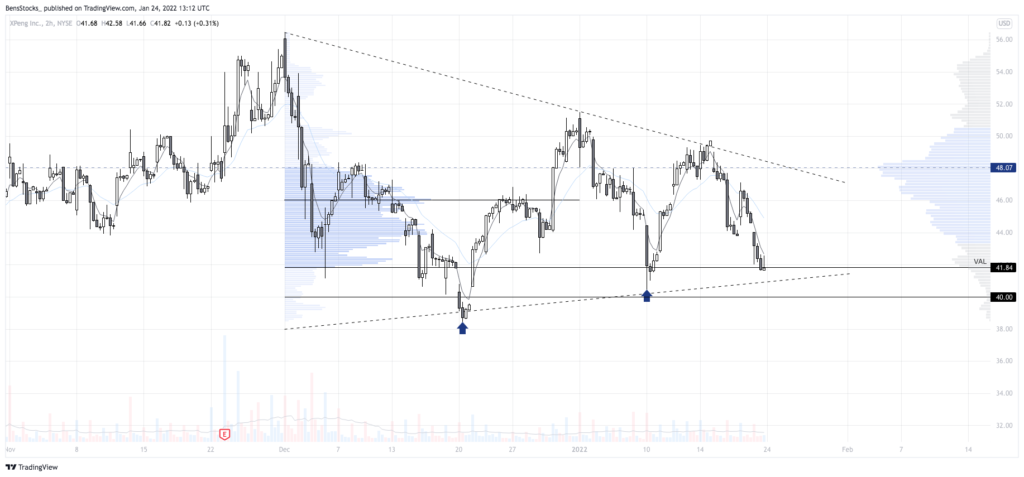
- Price put in “weak lows” (indicated by blue arrows) outside the value area
- $42 support
- $35.5-$33.5 is next support
