Market Outlook: Chart work and analysis
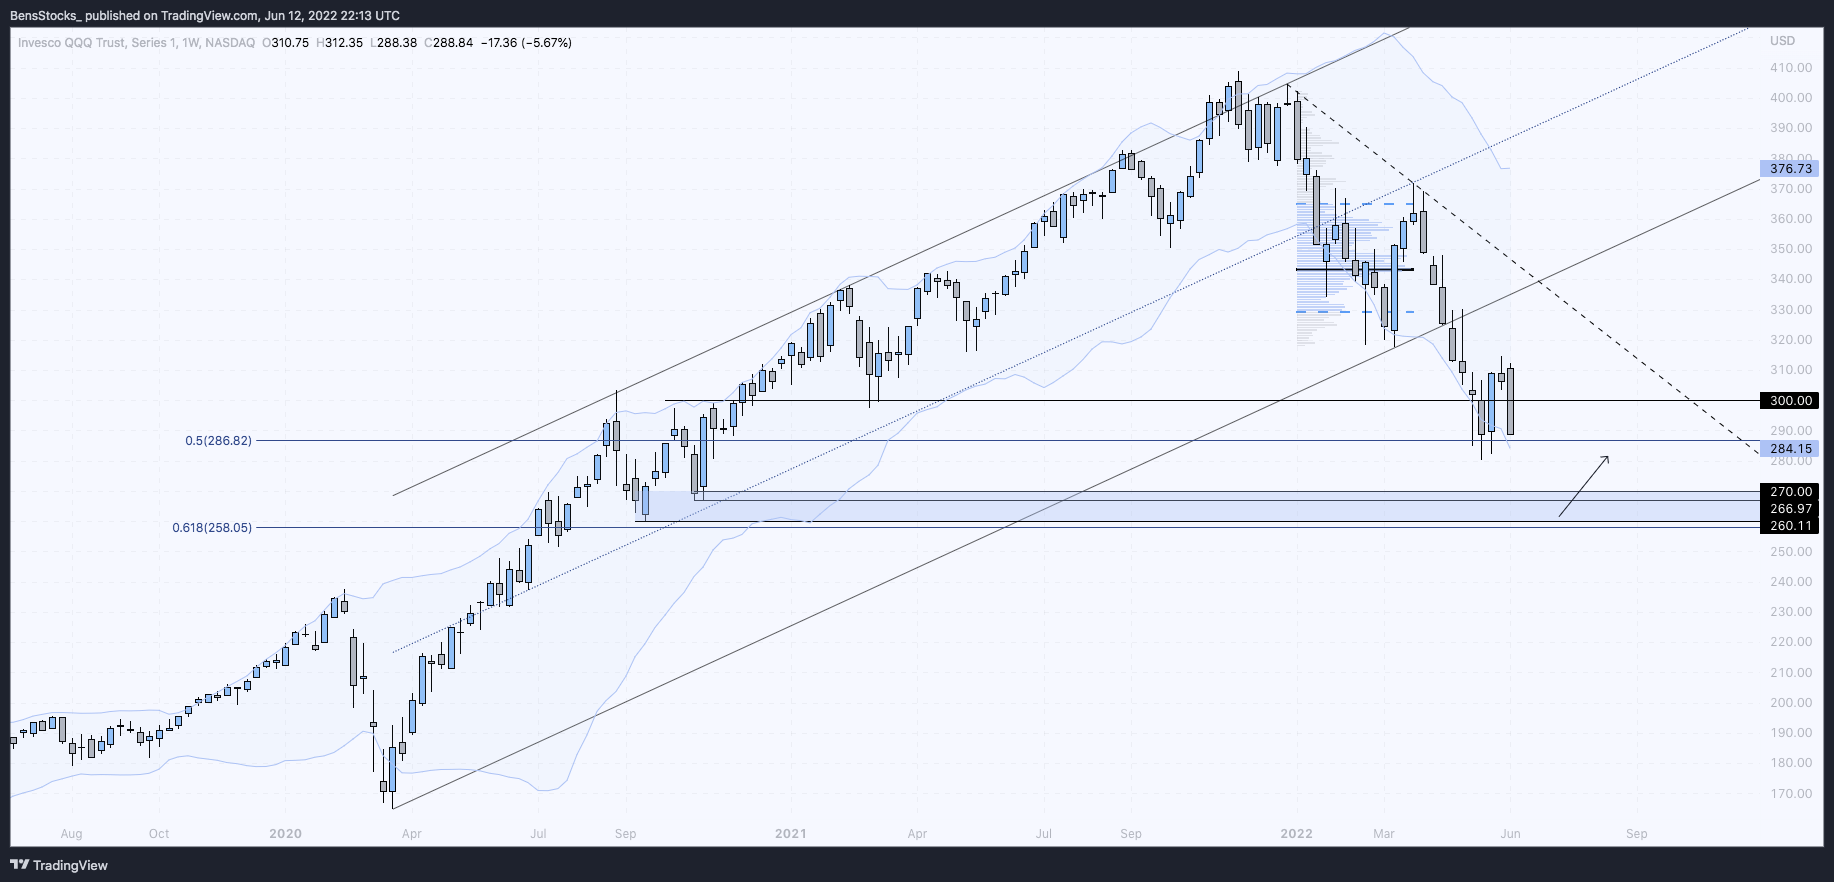
$QQQ Multiple time frame analysis
After trading in a range for an 8 day period, last thursday we confirmed to the downside out of this range. The following morning prices opened lower and continued to lower for the remainder of the session, with $QQQ closing -1.56 (3.53%) on the day. A number of market leaders sustained large technical damage during this sudden sell off as a result of poor cpi data.
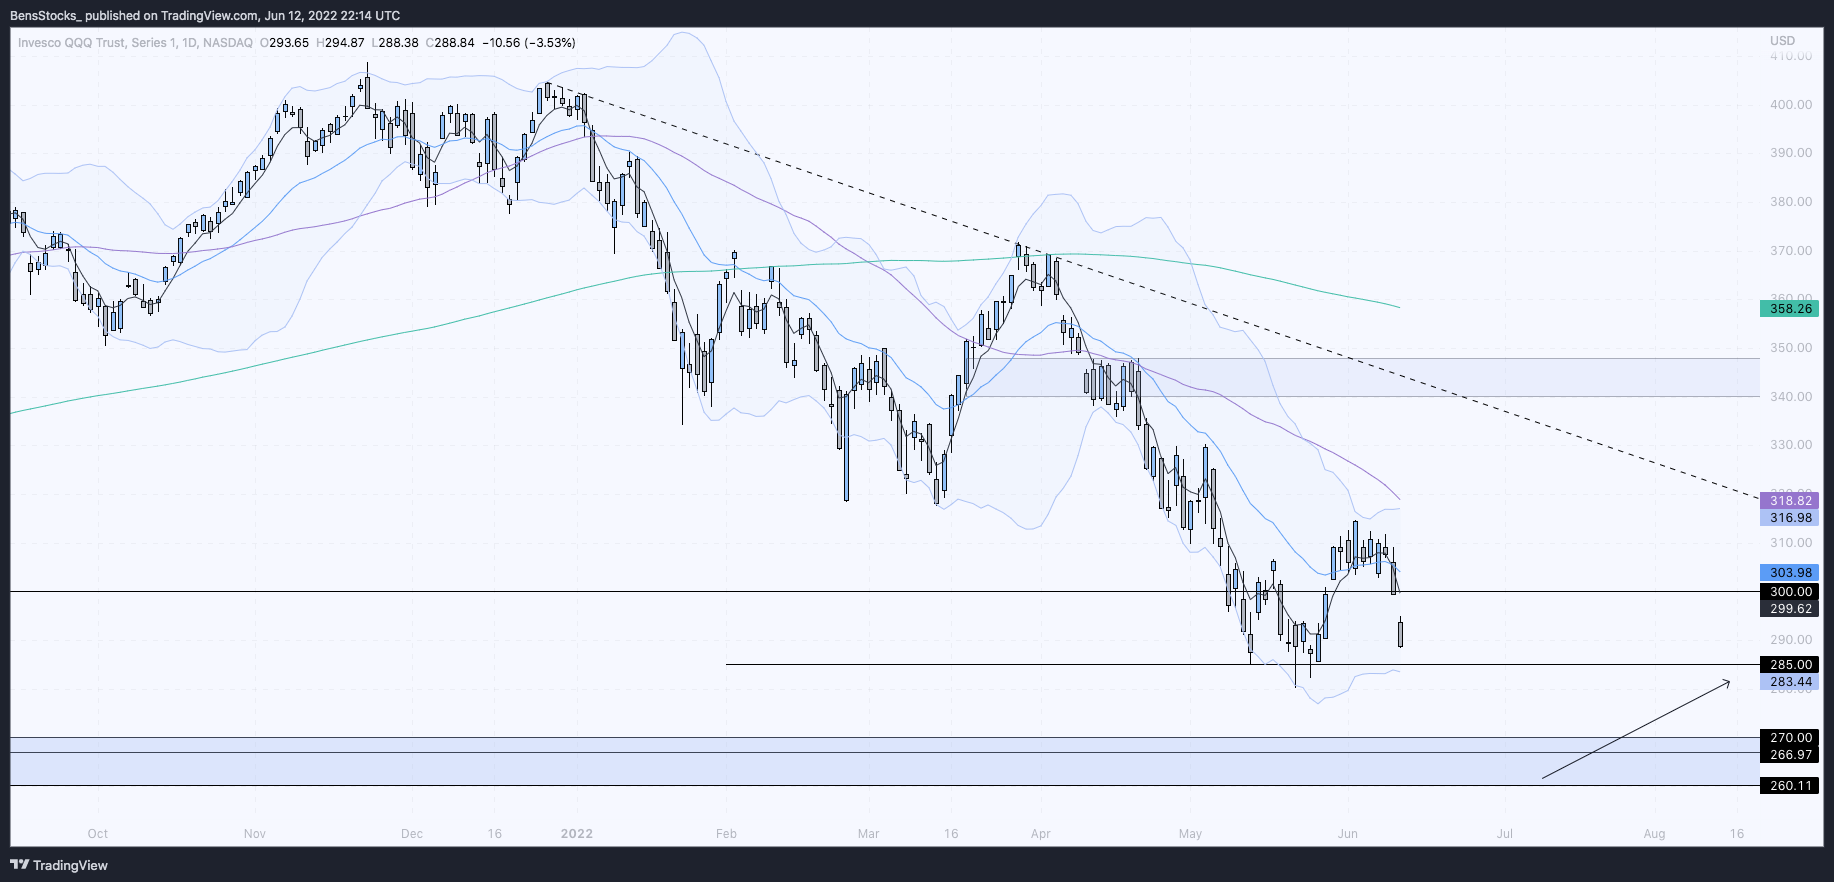
The daily time frame is signaling that price attempted to reverse above the 21 day ema, but lacked follow through. Leading to us breaking down out of the range to the downside. We closed in the middle of a range, not quite testing the $285-$280 lows, but also significantly extended from the prior weeks high and the 5 day ema. This could possibly be a recipe for a rest day tomorrow. We must take it day by day in this market.
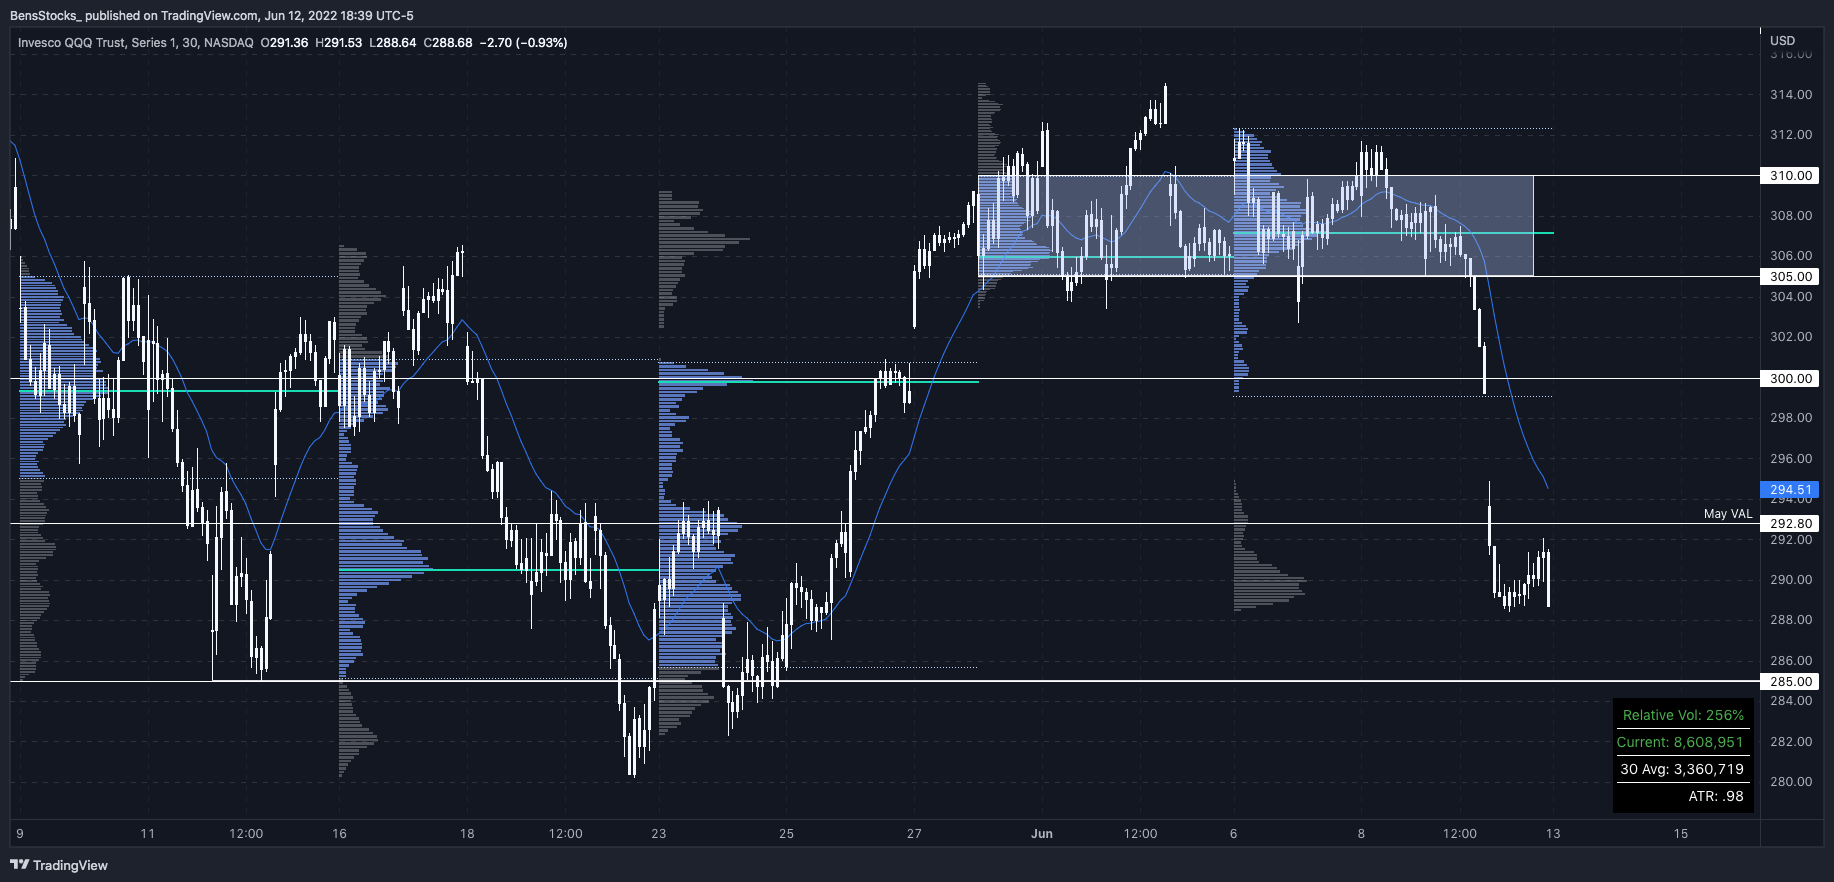
On a smaller time frame, we can clearly observe where the balance was occuring, indicated by the box drawing. What make this a balance area? The overlapping value areas. This to me indicates that price is consolidating before producing a trend move, breaking out of the box in either direction. What I am watching for on the smaller time frames is a break of the prior days low, or a significant bounce from it. Testing the local lows seems like the path of least resistance at this point.
individual setups
To my process it is important to go through the basket of stocks I watch during my nightly preparation. This allows me to capture the overall breadth of the stocks I trade, and informs me whether to lean short or long bias for the trading days to come. I use Trend Spider’s scanner. To sum up the results: Lots of names are stuck in the middle of their ranges, but overall I am leaning short bias this week. Last week’s sell off led to lots of charts breaking down, which in turn makes way for the names who haven’t had an aggressive leg down yet to do so in the coming sessions. Keep an open mind however, we could see an aggressive bounce this week, no one knows! Here are some charts I like to keep on watch for continuation/breakouts.
$mu 2d
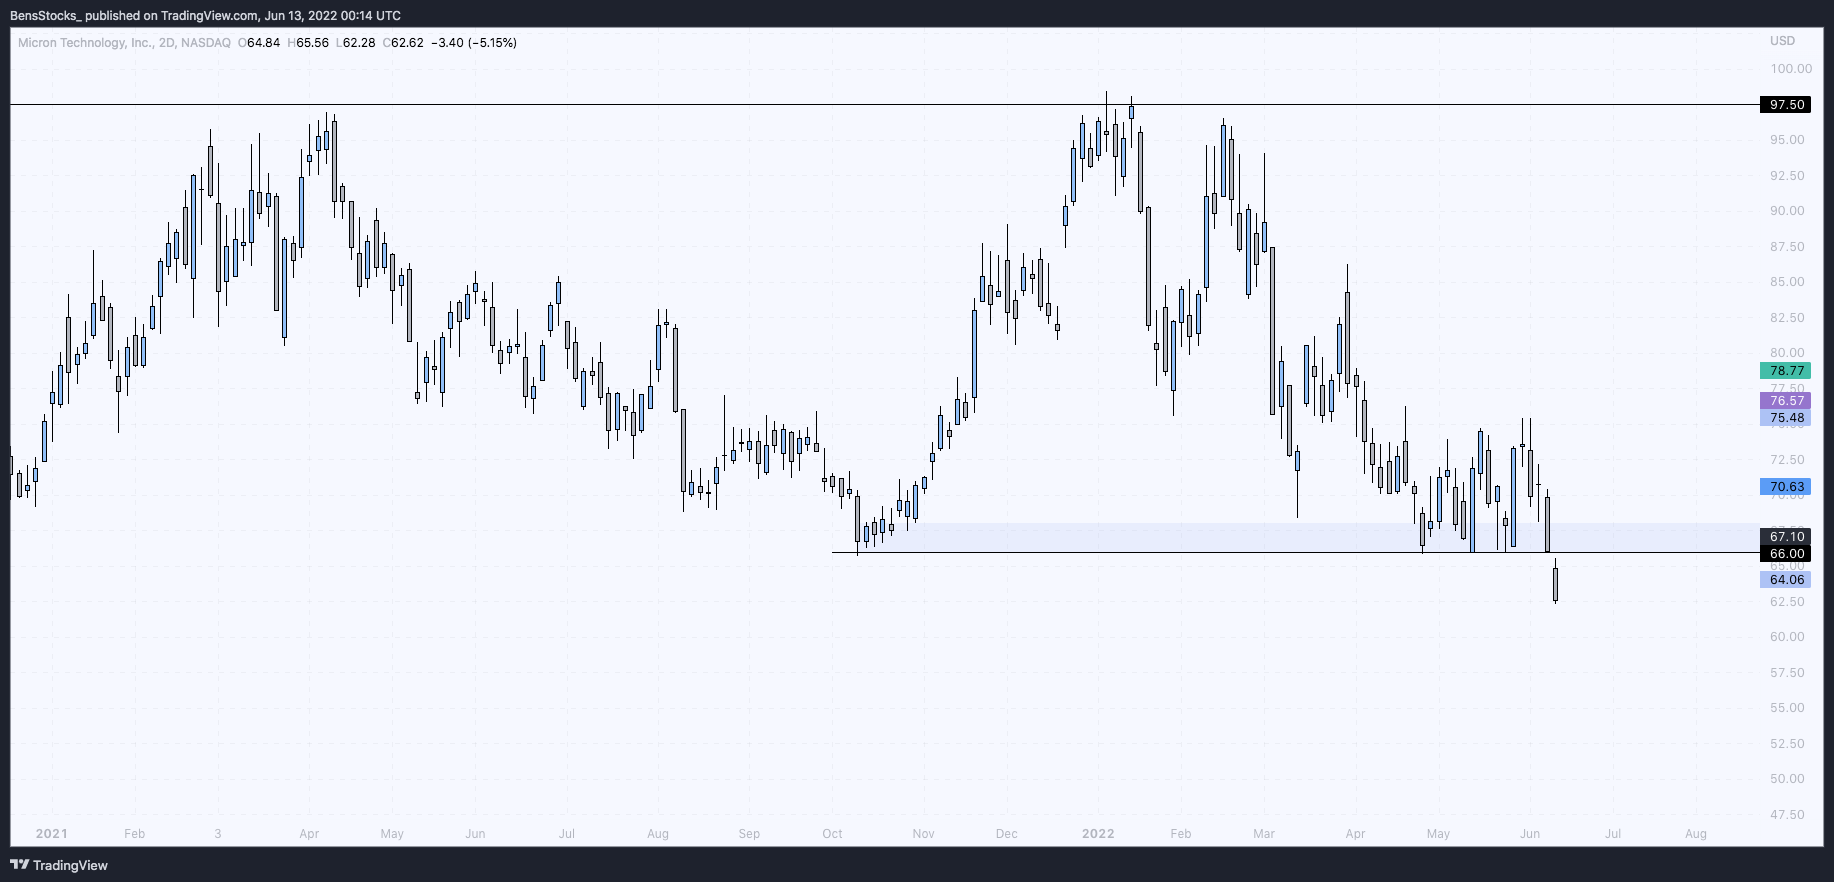
- Losing $66 key support level
- Lots of “room below” (range)
- Closed below lower Bollinger Band
$amzn daily
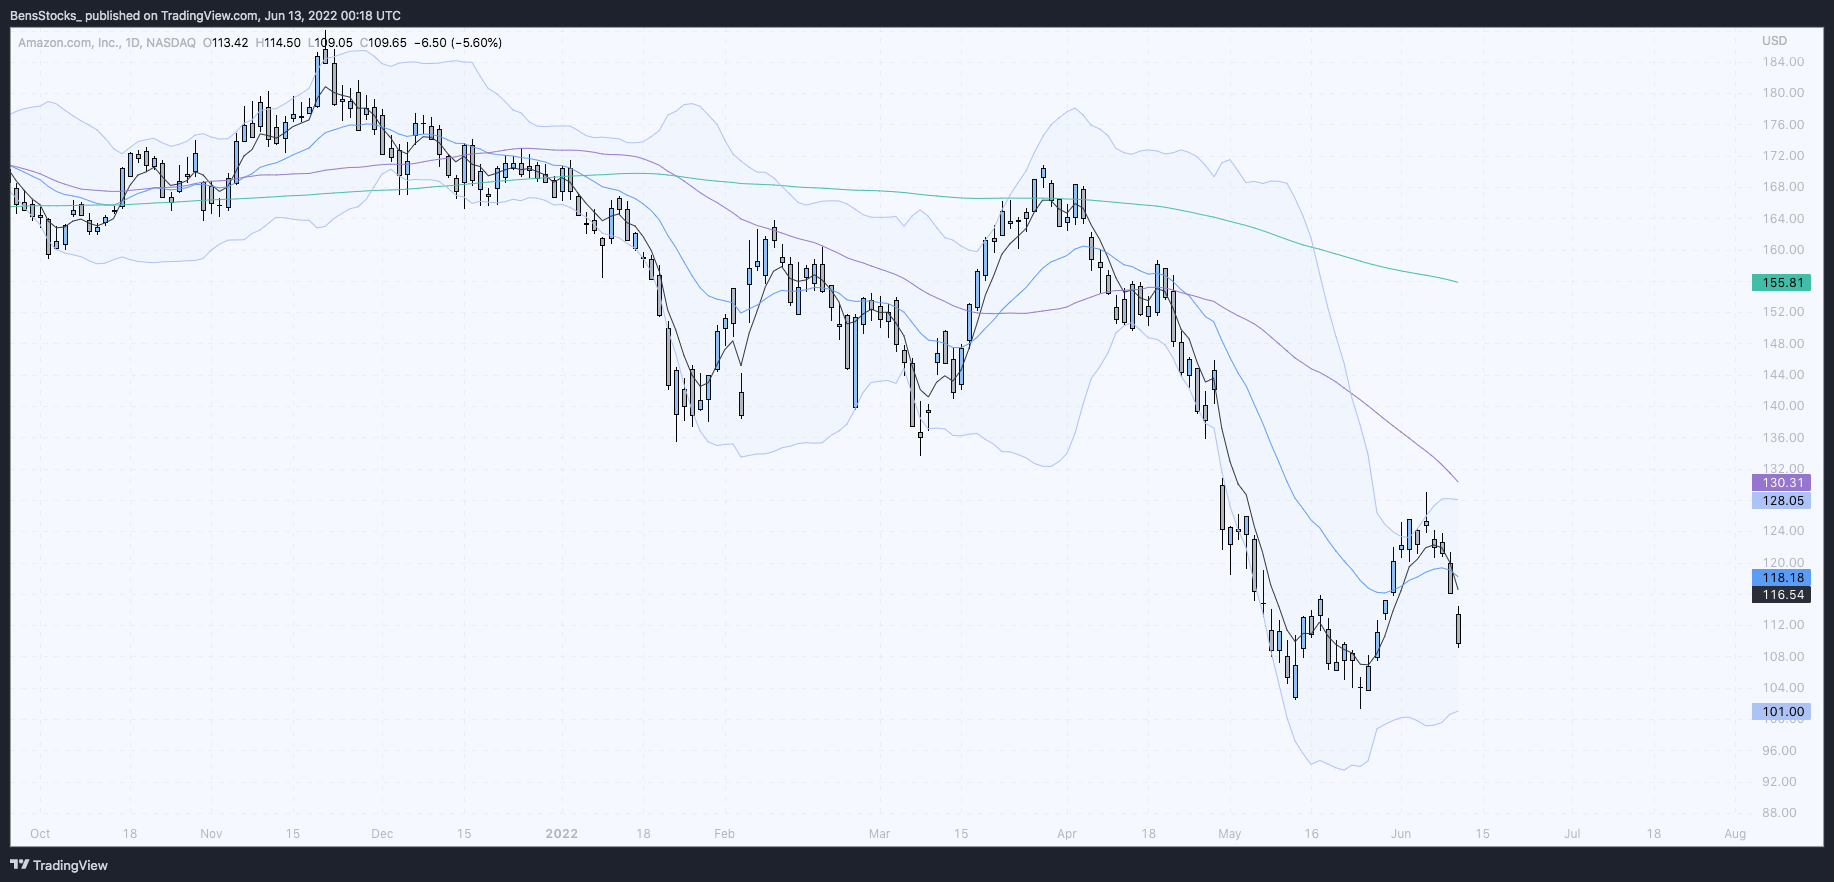
- Looking for move back to $100
- Like I mentioned, stuck in middle of range but watch for continuation
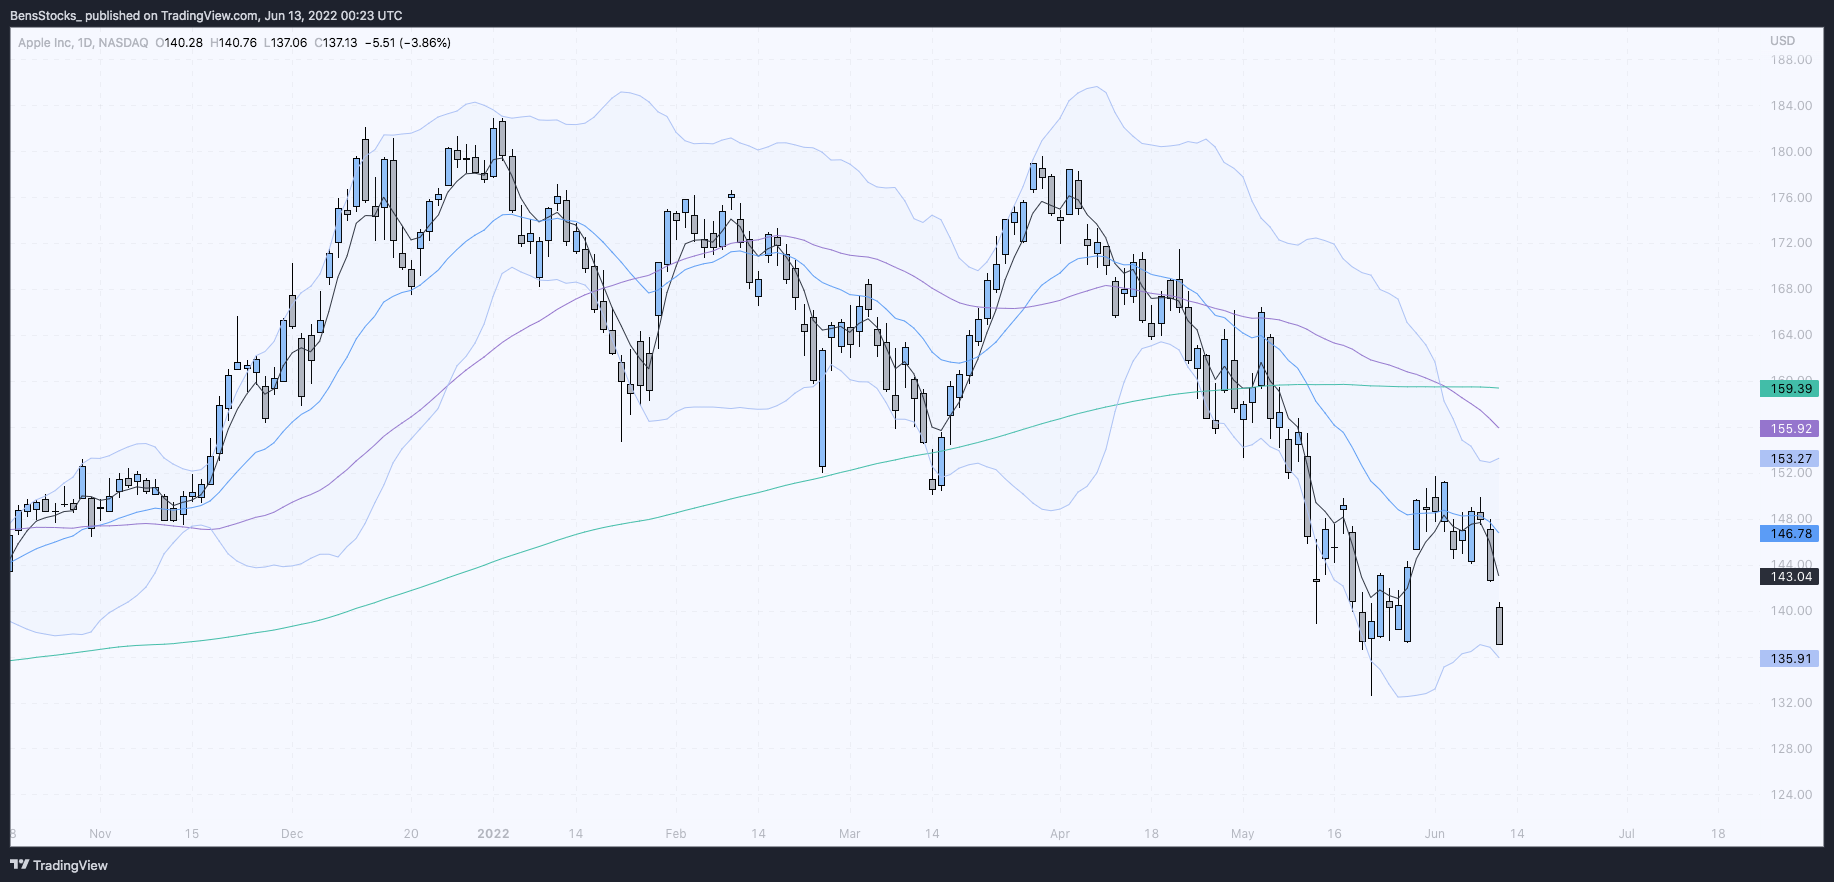
$aapl daily
$aapl 30 minute
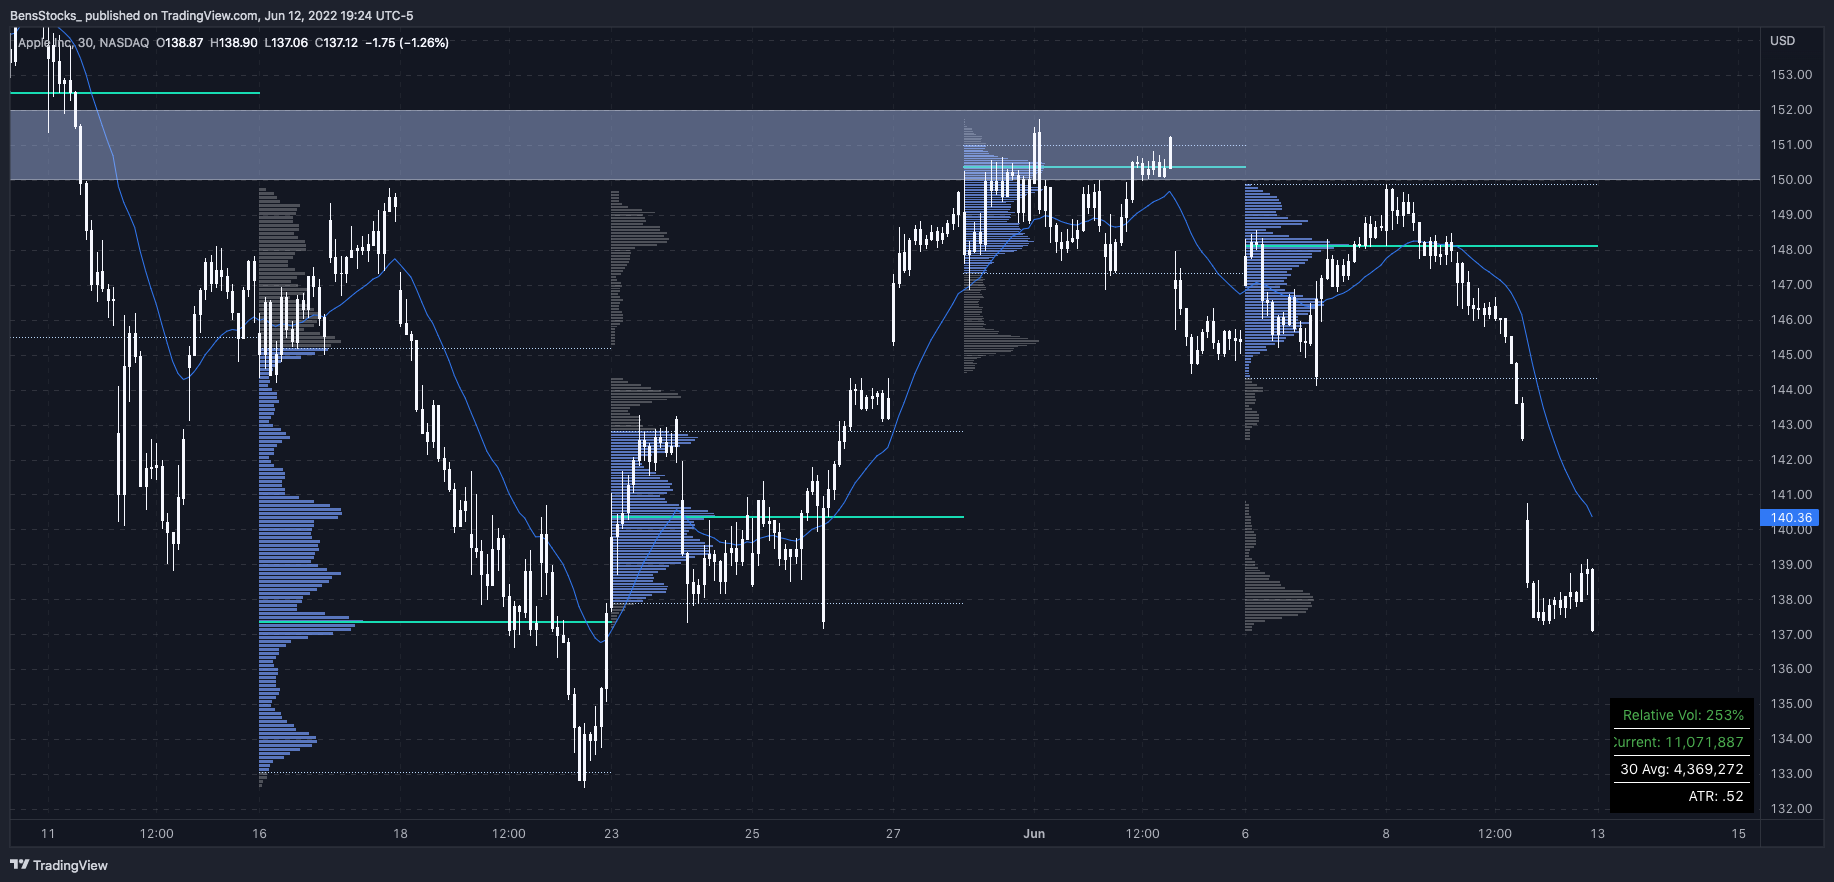
- If we do get a bounce day, Apple is a best candidate for bounce trades
- Trading within prior weeks value area
- Over extended from 5 day on daily time frame
