1/10/2022-1/14/2022
$Arkk
Continued selling in growth stocks has led me to revise my $ARKK count. In last weeks post, I was looking for a reversal out of the $93 range. Once this support was lost, things got ugly for $ARKK quickly. However the overall corrective structure remains intact and it still seems to me a reversal should be under way soon. I am a trader, not an investor, so I cannot speak on the longevity of $ARKK and it’s future. My job is to analyze the price charts and create opportunities out of my interpretation of the data provided. It is a good thing $ARKK, and all other markets, move independently regardless of people opinions.
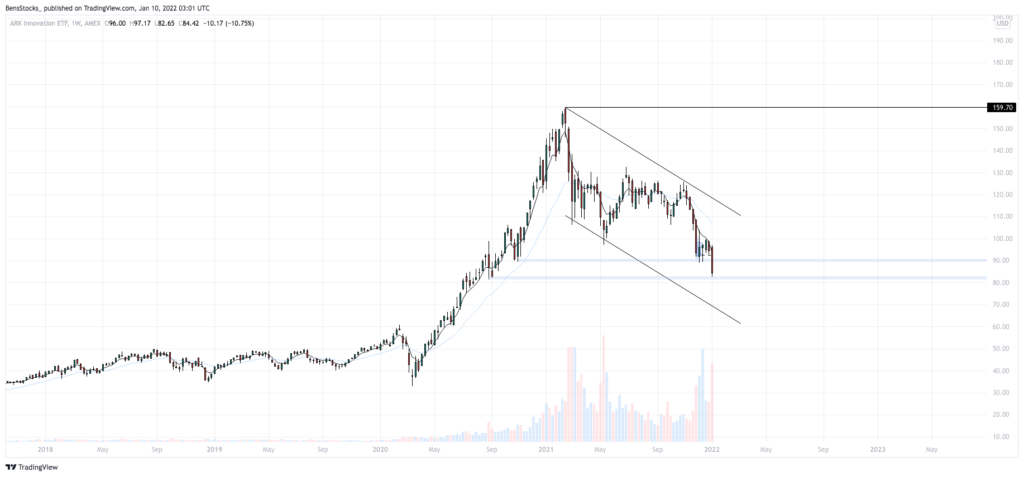
$arkk 1w scale
$ARKK is approaching key support, if a reversal is coming now would be the time. Price holding the demand zone around $80 is essential, if not more downside is to be expected with downside targets of $70, then $60 if $70 cannot hold.
Support: $80.00
Resistance: $90.00
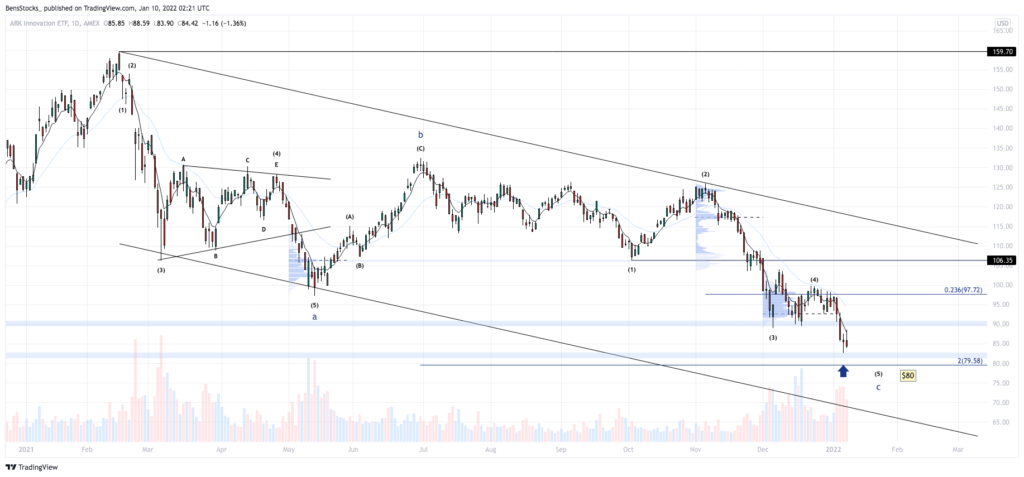
$arkk 1d scale
As mentioned above in last weeks post I was expecting a reversal off of $93, and while the bounce did happen out of my projected buy zone, it was met with relentless selling pressure once reaching the $98 level. Price is still in an overall downtrend, but as we approach the key $80 level I am certainly watching for a bounce out of the demand zone depicted in the chart. If $80 is lost, there is no telling where the selling may end, thus it is the only support level I have noted for this week. $ARKK needs to reclaim $90 for any bullish action to ensue.
Support: $80.00
Resistance: $90.00
$QQQ
Despite the selling in growth stocks, $QQQ has held up quite well, but it seems the tide may be shifting. The FED and the QE cycle are the driving factors behind this correction in growth stocks, and it seems the indices are going to be the last to get hit. I will take this opportunity to reiterate that I am a trader, not an investor, and certainly not a macro economist. I trade what is in front of me on the charts and manage my risk accordingly. That is my only job. I will leave the valuations and macro economic forecasts to the pros. No bias or opinion here, only technical analysis.
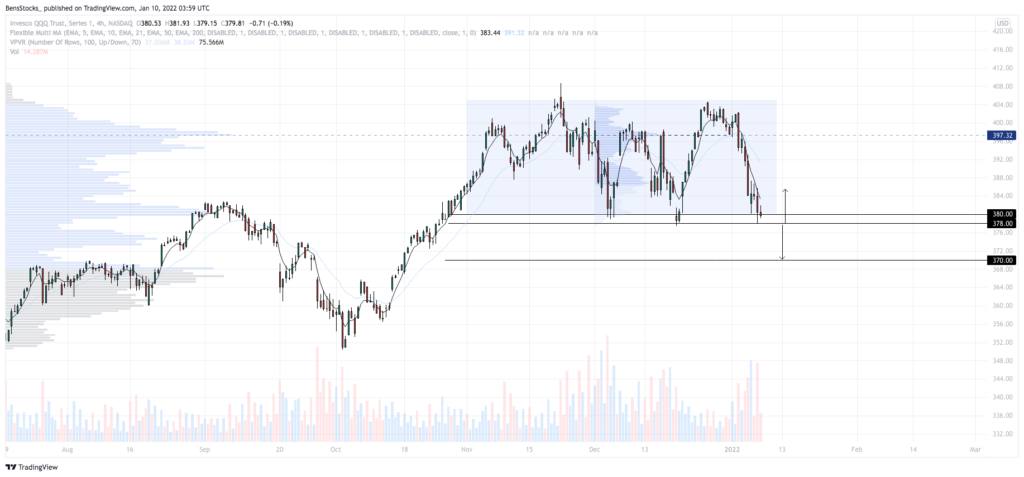
$qqq 4h scale
$QQQ has been trading in sideways range since making an all time high at $408.71. If $380 can hold, there is a good chance we get a retest of upper levels. With that being said, these levels play both ways. $QQQ below $380 would be a great short and I will certainly be watching for this opportunity if it presents itself.
Support: $380.00, $378.00, $370.00
Resistance: $386.00, $397.20
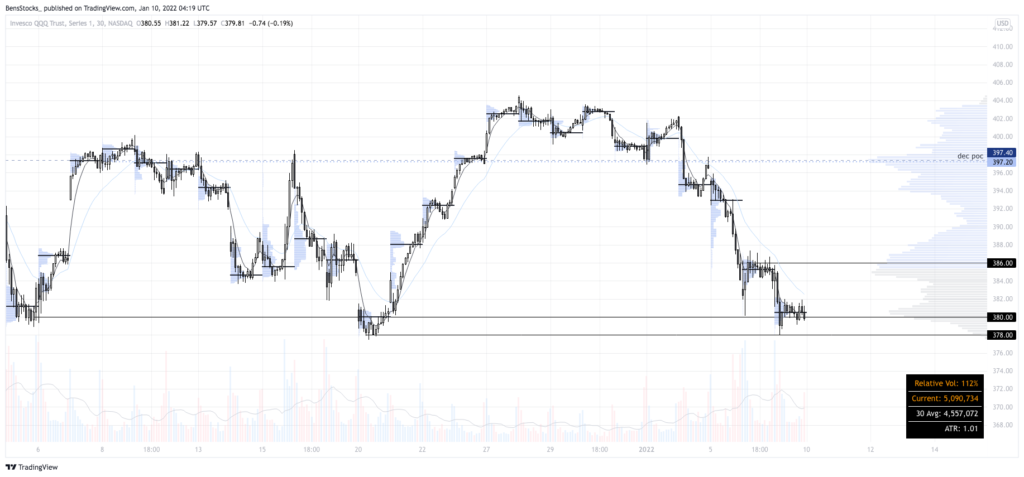
$qqq 30m scale
The micro time frame of $QQQ is showing no signs of a reversal. $386 is looking like a high probable short opportunity. $QQQ needs to make a higher low above $380, and then take out $386. Play the levels to both the long and short side this week. The market can do whatever it wants, so it is important to be ready for both sides of a predefined level. Wait for confirmation, define your risk, then execute.
Support: $380.00, $376.00
Resistance: $386.00
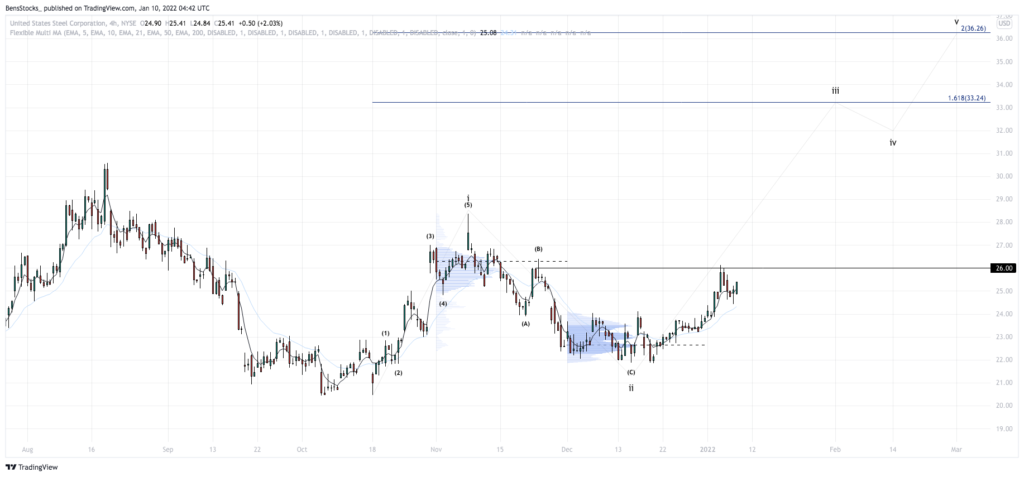
$x 4h scale
The growth sell off has made way for other sectors to shine. $X above $26 could provide a great long opportunity for a swing to the Wave 3 target at 1.618 extension ($33)
Support: $24.00
Resistance: $26.00, $28.00
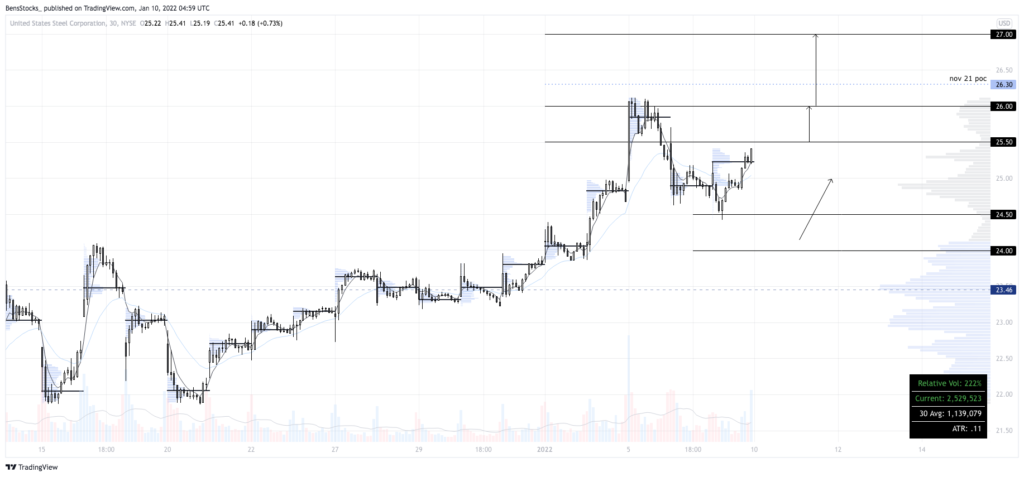
$x 30m scale
Respect the levels.
Support: $24.50, $24.00
Resistance: $25.50, $26.00, $27.00
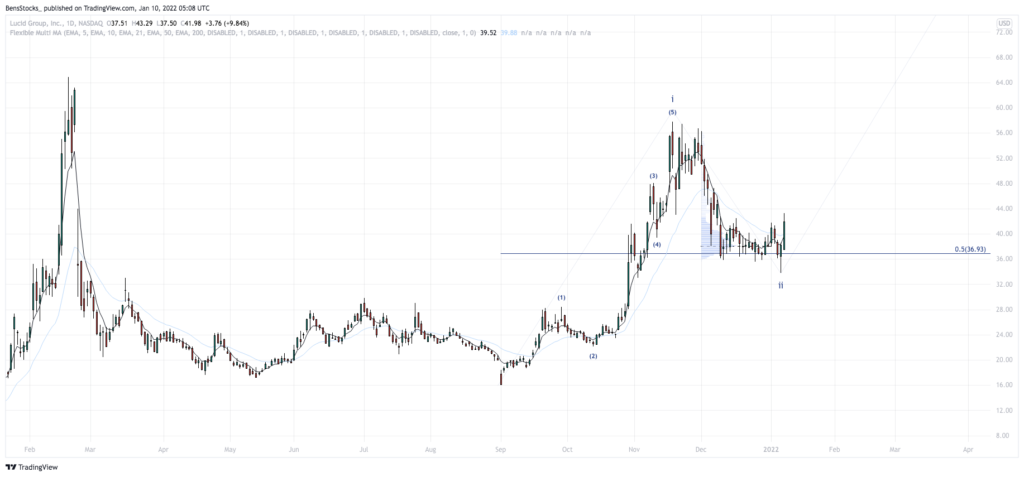
$lcid 1d scale
After $TSLA crushed their Q4 delivery numbers, the EV sector started to heat up again. $LCID put in a higher-low at the .5 retrace ($36.93). Price is also above the 21 day ema and we are not setting up for a bullish 5-21 ema cross.
Support: $36.00
Resistance: $45.00
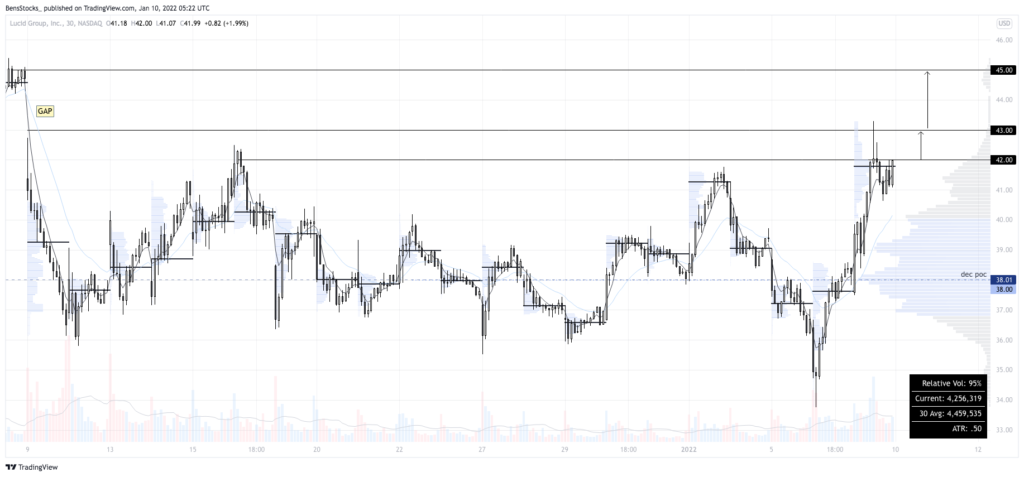
$lcid 30m scale
With a gap to fill to the upside, $LCID looks ready to visit $45 rather quickly. I will be playing the $43 level if the opportunity presents itself for a long at that price. Respect the levels.
Support: $41.00, 21 ema
Resistance: $42.00, $43.00, $45.00


