1/3/2022-1/7/2022
$arkk
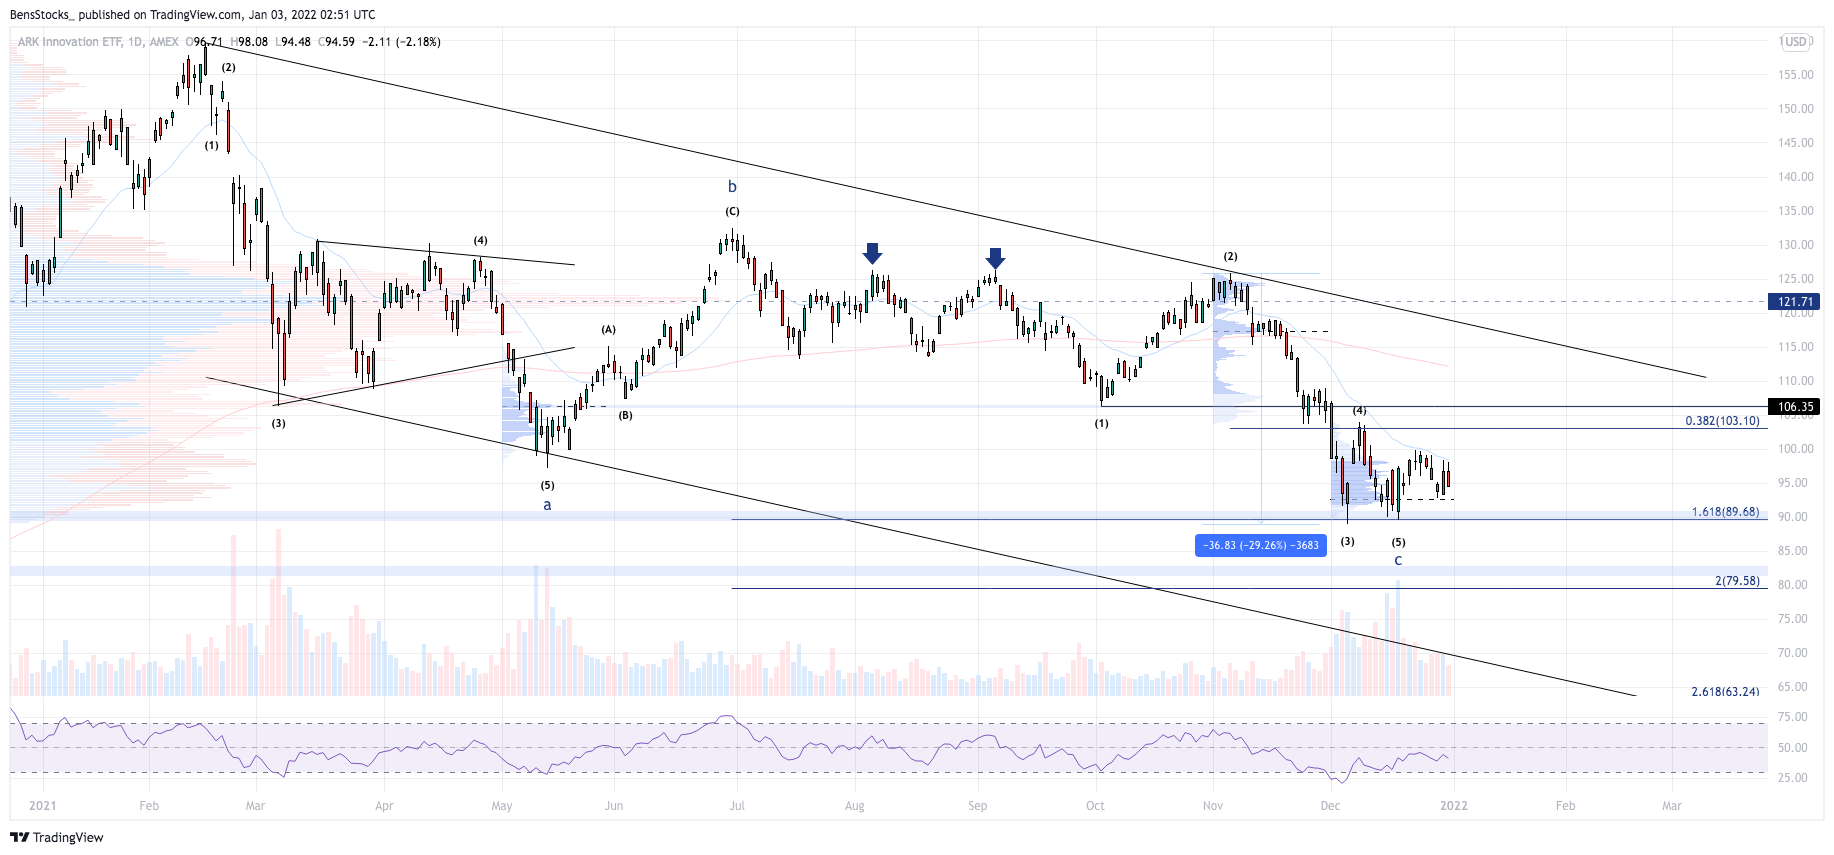
After a 37 point sell of in $ARKK from a recent pivot high ($125.86), we are starting to see some growth names base and reverse. While the overall trend on $ARKK is still down, the smaller time frames are showing signs of strength and reversal structure.
$ARKK 1d Scale
As you can see on the larger time frames $ARKK has been trading in a downward channel since making an all time high at $159.70. After completing a ZigZag correction I am looking for $ARKK to start making higher lows on the daily time frame, as well as reclaim the 21 day ema
Support: $89.00, $93.00
Resistance: $98.40, $100
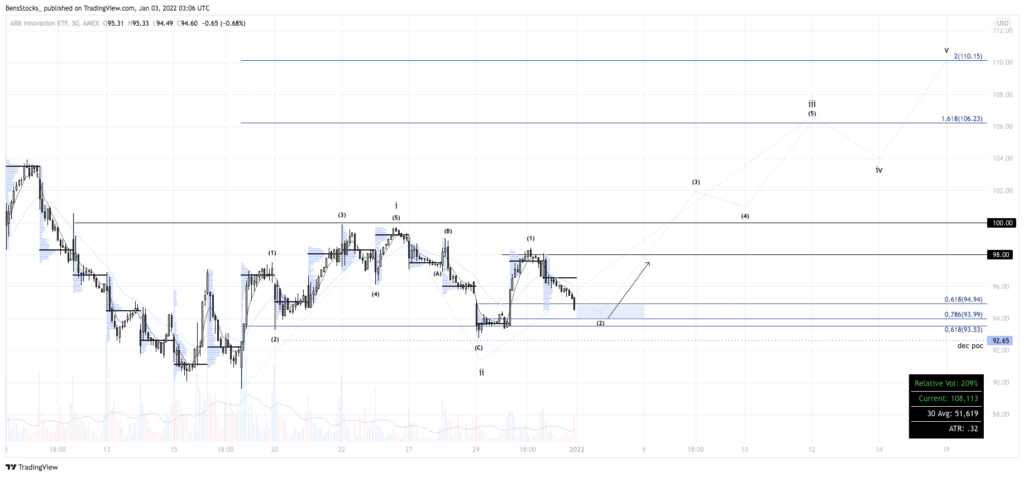
$arkk 30m Scale
$ARKK on the smaller time frames is providing some great trading opportunities. The volatility is there and we are starting off a new year. I am looking for a long opportunity around the $93-$94 range.
Support: $94.00, $93.00
Resistance: $96.50, $100.00
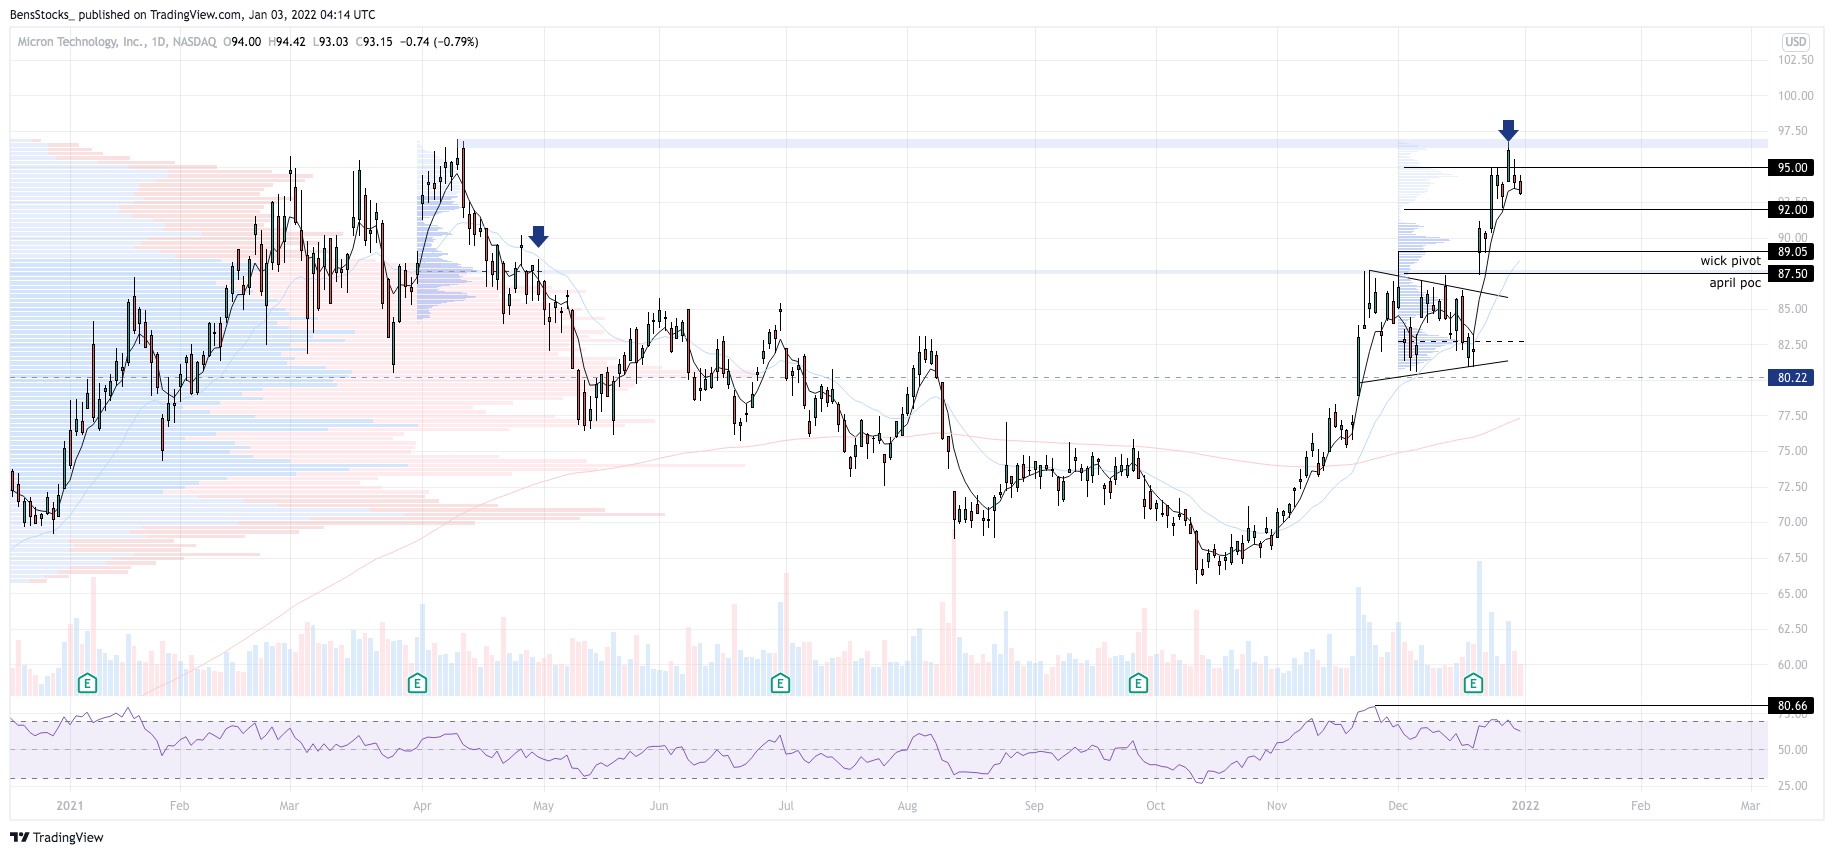
$mu 1d scale
Sometimes there is no need to get creative. Semiconductors have been hot, and $MU is one of the few that hasn’t made a new high yet (although it came close, wicking into supply levels near the all time high of $96.69). The bigger picture here is that price is extended from the 21 day and closed below the 5 day last week. It seems a slight pullback is in order, which brings us to the next image…
Support: $92.00, $89.00, $87.50
Resistance: $95.00, $96.96
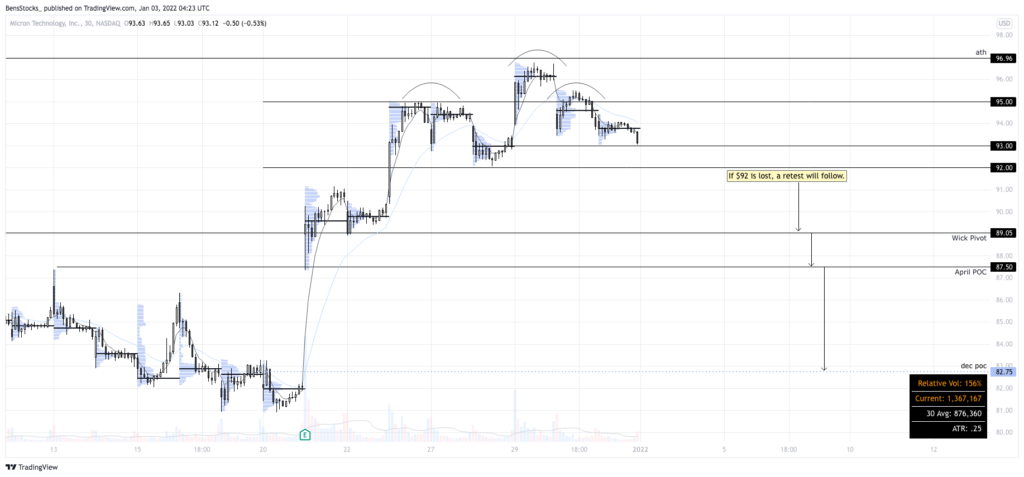
$mu 30m scale
After wicking into all time high supply, a head and shoulders patterned has formed suggesting a move to the downside. $92 is the key level here. This is a price you can play long and short off of. The directional movement of $MU will depend on the overall strength of other semiconductor names, this could easily make new highs in the following weeks of January.
Support: $93.00 $92.00
Resistance: $95.00, $96.69
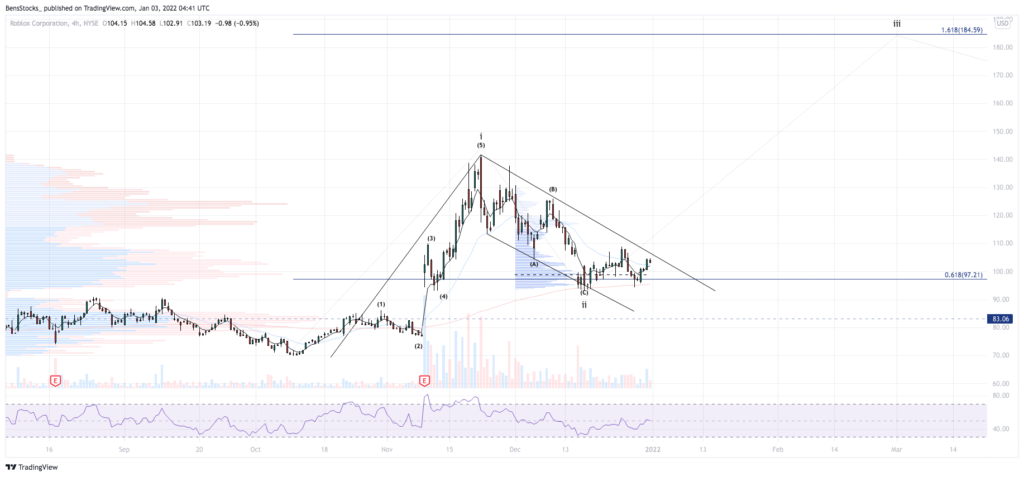
$rblx 4h scale
What a lovely bull-flag formed on the daily/4hr time frame, along with a nice ‘B shaped’ volume profile for the month of December (indication of buyer presence). Bull-flag + ABC correction + .618 volume profile confluence + 21/200 ema chanel = A+ setup.
Support: $98.90 $93.00
Resistance: Downward trend line, 21 ema
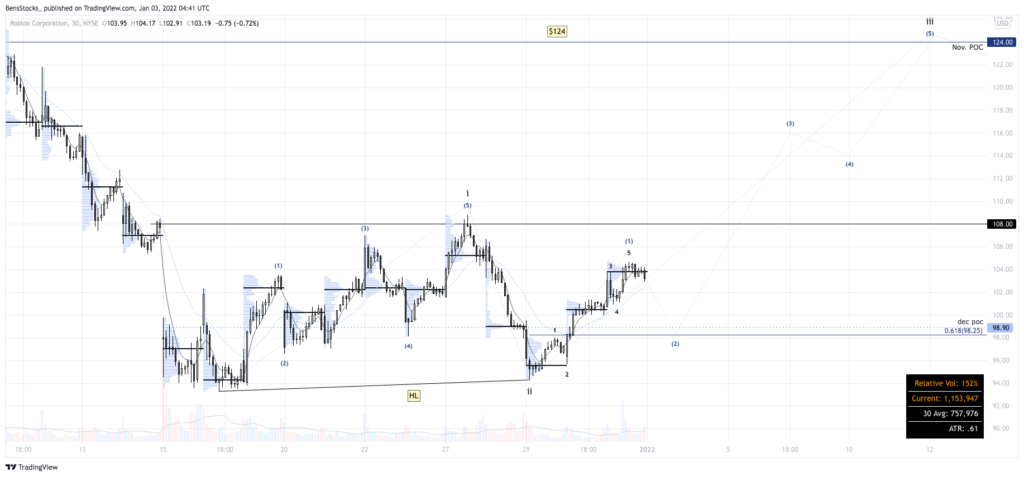
$rblx 30m scale
The Elliott Wave Count proposed here contains very bullish structure and offers huge upside potential The 5 wave structure to the upside suggests a corrective move is to follow. A long out the ‘dec poc’ level along with the .618 retrace confluence is a very high probable trade if $RBLX cooperates.
Support: $98.90, $98.00
Resistance: $104.70, $108.00

